
Every Reading, Not Every Sixth One
Encoded ultrasonic wall-loss mapping — full coverage, in the format your fitness-for-service assessment actually needs.
Corrosion Mapping: Full-Coverage Wall Thickness Surveys
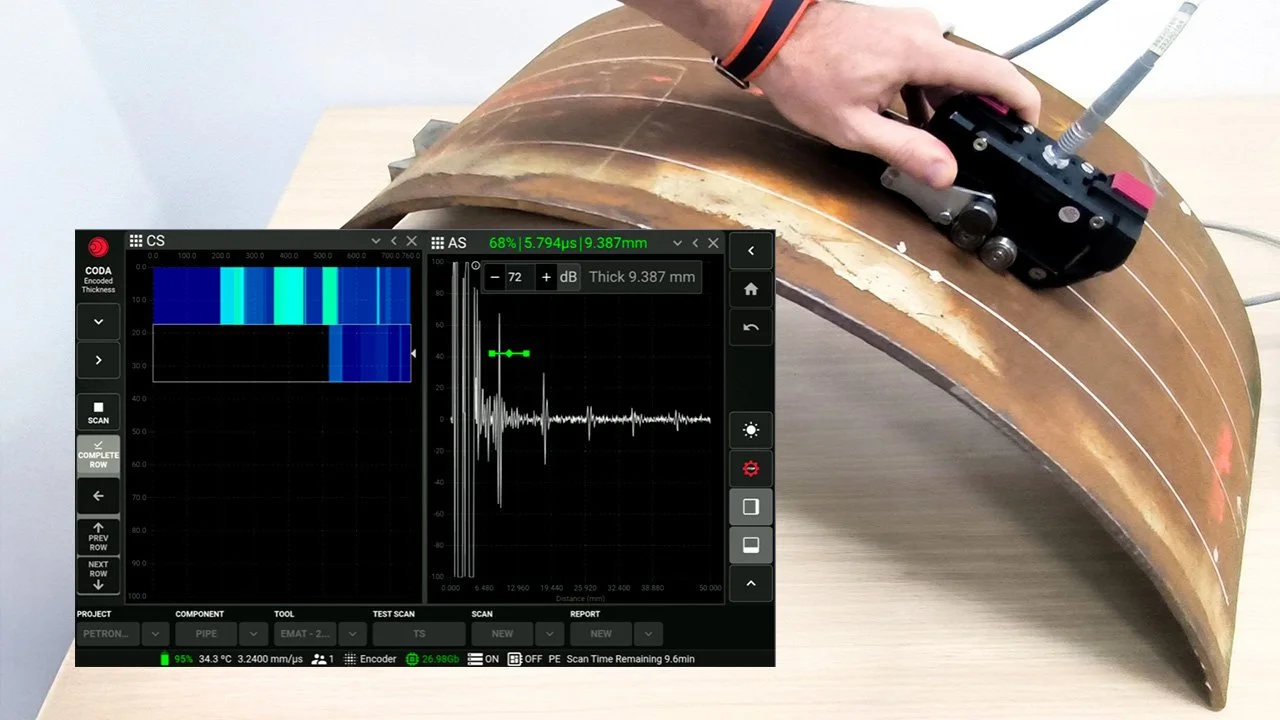
Corrosion mapping is ultrasonic thickness measurement with the gaps taken out. Instead of a technician taking readings at fixed points and trusting that nothing important happened between them, an encoded scanner sweeps the surface and records thickness continuously — producing an image of remaining wall across the whole scanned area. Corrosion stops being a column of numbers and becomes a picture you can point at.
When a Thickness Survey Isn't Enough
Most fixed equipment is monitored with point thickness readings at established condition monitoring locations. That works while corrosion is uniform. It stops working the moment it isn't.
There is a formal test for this. An API 579 fitness-for-service assessment using point thickness readings requires a minimum of fifteen readings, and if the coefficient of variation across them exceeds 10 per cent, point readings are no longer acceptable — the assessment has to move to thickness profiles taken from a grid. That threshold is where a routine survey turns into a mapping job, and it is usually discovered by an engineer who has already paid for the survey.
The practical version: if your CML readings are scattering, if a remaining-life number is being challenged, or if you suspect pitting or channelling between your monitoring points, spot readings cannot answer the question. Mapping can.
What You Actually Get
A mapping survey is a data deliverable, not a certificate. Every job produces:
A C-scan — plan-view colour map of remaining wall across the scanned area, with the thinnest regions immediately visible.
B-scan cross-sections — profile views through the wall for any line across the scan, showing the shape of the loss.
Minimum remaining thickness — the single number your integrity calculation needs, located precisely rather than estimated.
The raw encoded data files — so your engineer, or a third-party reviewer, can audit the scan rather than taking our word for the summary.
That last point matters more than it looks. A thickness report is a set of conclusions. An encoded data file is evidence, and owners' engineers increasingly ask for it by name.
Corrosion Mapping vs. Spot Thickness Readings
Both have a place, and quoting the expensive one for a job that doesn't need it is how vendors lose integrity clients.
Spot readings win on cost and speed for routine CML monitoring where corrosion is known to be general and the trend is stable. Most of your programme should stay here.
Mapping wins on coverage. It finds the localised loss a grid samples straight past — pitting, erosion at flow disturbances, under-deposit attack, and the channelling that shows up downstream of an injection point.
A useful rule: sampling tells you whether the equipment is corroding. Mapping tells you where the worst of it is, and how bad. When the decision in front of you is repair, re-rate or run, you need the second answer.
Where We Map
Encoded mapping works on any surface a scanner can be tracked across: pressure vessel shells and heads, process piping including elbows and bends, aboveground storage tank shell plate, spheres, and components in restricted access where a manual grid would be impractical or unsafe. It is equally at home on a scheduled turnaround scope and on a single suspect area found during a routine survey.
Where the asset is insulated, mapping usually follows a screening step rather than replacing it — see our corrosion under insulation work for how the two fit together.
On-Stream and High-Temperature Work
Standard phased array probes and wedges are limited to roughly 80°C at the surface, which rules out a great deal of operating equipment. High-temperature probe and delay-line arrangements extend encoded inspection well above that, and purpose-built high-temperature solutions run continuously into the 250°C range with active probe cooling.
The practical consequence is that a mapping survey no longer automatically means a shutdown. Tell us the operating temperature, the insulation arrangement and the access, and we will scope the setup that gets the data without taking the unit down — or tell you honestly that this one needs to come off line.
Feeding Your Integrity Programme
Mapping data is worth what your engineer can do with it. Scans are delivered in the format an API 579 assessment consumes: thickness profiles along critical inspection planes rather than a scatter of unrelated points, with the minimum measured thickness and the extent of the thin area both defined.
The same data supports API 510 pressure vessel, API 570 piping and API 653 tank inspection programmes, and the corrosion rates it produces are calculated from mapped area rather than from a handful of points that may or may not have found the worst of it. Where the mapping turns up something that needs explaining rather than measuring, our metallurgical lab handles the failure analysis under the same roof.
Got a thickness survey that raised more questions than it answered? Send us the readings and the equipment details — 780 468 4593, or through the quote form — and we will tell you whether mapping is the right next step or a waste of your budget.
Frequently Asked Questions
What is corrosion mapping?
Corrosion mapping is an encoded ultrasonic technique that records wall thickness continuously across a surface rather than at spaced points, producing a colour image of remaining wall. It reveals pitting, erosion and localised thinning that spot thickness readings can pass straight over, and delivers the minimum remaining thickness with its exact location.
When do I need corrosion mapping instead of a thickness survey?
When corrosion is not uniform. An API 579 assessment using point thickness readings needs at least fifteen readings, and if their coefficient of variation exceeds 10 per cent the assessment must move to grid-based thickness profiles. Scattered readings, suspected pitting, or a challenged remaining-life calculation all point to mapping.
Can corrosion mapping be done while equipment is running?
Often, yes. Standard phased array probes are limited to roughly 80°C surface temperature, but high-temperature probe arrangements extend encoded inspection well beyond that, with purpose-built solutions working continuously into the 250°C range. Send us the operating temperature and access details and we will confirm before mobilising.
What deliverables come with a corrosion mapping survey?
A C-scan plan view of remaining wall, B-scan cross-sections through any line of the scan, the minimum remaining thickness with its location, and the raw encoded data files. The data files let your engineer or a third-party reviewer audit the scan itself rather than only the summary report.